Find me online


My Books
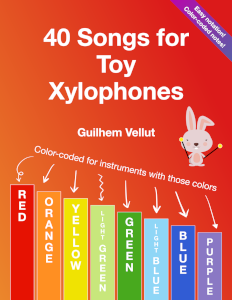
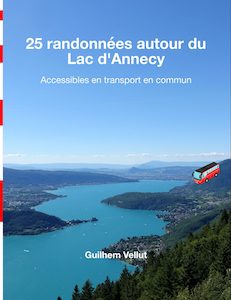
I have published a variety of books, including sheet music for toy xylophones available in multiple languages, hiking guides for Japan and France and photography books.
|

|
|
|
Consulting
I offer consulting services in software engineering and GIS data science. Feel free to contact me for opportunities.
Websites
- Color Customization Tool for Toy Xylophone Sheet Music
- Generate PDFs of color-coded sheet music for all models of 8-note xylophones
- TPPSS Savoie
- Compute sunrise and sunset times, taking into account the local mountains and hills (Savoie, Haute-Savoie, Geneva)
- Vellut Maps
- Thematic maps around Annecy: webcams, hike reports, geolocated photos of trails (coming soon)
- Random String Generator
- Generate random text strings (digits, uppercase or lowercase letters, special characters)
- SVG to PNG (or icns)
- Convert SVG to PNG or Apple icns icons for app icons or favicons
Projects
- jncep
- Command-line tool to generate EPUB files for J-Novel Club and JNC Nina pre-pub novels
- PiqoPiqo
- JPEG viewer + metadata editor, for triaging photos and uploading to Flickr
- gpx2exif
- Command-line tool to add GPS info from a GPX file to EXIF tags in local images or to images hosted on Flickr
- TPPSS
- Command-line tool to compute sunrise / sunset times taking into account local topography